Application Guide: Extracellular Vesicles (EVs)
Spectradyne’s ARC™ Particle Analyzer
for Extracellular Vesicle Characterization
Published:
Revision: V3
Overview
Spectradyne’s ARC™ particle analyzer is rapidly being adopted for extracellular vesicle (EV) analysis in research and GMP lab environments. The ARC delivers direct, accurate measurements of EV size, concentration, and single-particle fluorescence that are not accessible with purely optical techniques.
From basic EV quantification to quantitative multiparametric phenotyping, the ARC enables fast, reliable, and easy-to-use measurements that deepen understanding of EV biology, strengthen scientific conclusions, and accelerate development workflows.
How the ARC Particle Analyzer Works
Spectradyne’s ARC particle analyzer uniquely combines two orthogonal measurement techniques to yield new insights into EV populations.
- Microfluidic Resistive Pulse Sensing (MRPS) directly measures single-particle size and concentration. MRPS is a non-optical, electrical method that is orthogonal to Dynamic Light Scattering (DLS), Nanoparticle Tracking Analysis (NTA), and Flow Cytometry (FC).
- Quantitative single-particle fluorescence enables direct phenotyping of EVs. Color multiplexing allows simultaneous measurement of surface markers, cargos, and co-expression patterns on a particle-by-particle basis.
Gold-Standard Accuracy for Size and Concentration
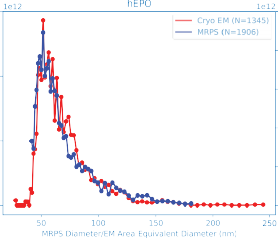
The close agreement between MRPS and Cryo-TEM validates the ARC’s accuracy for EV size and concentration measurements.
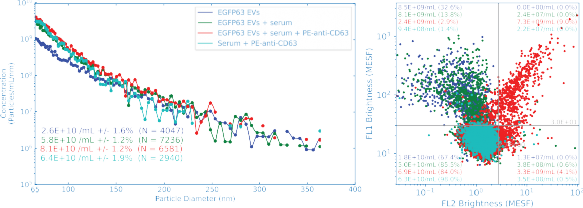
Quantitative Phenotyping of Extracellular Vesicles
The ARC delivers simultaneous measurement of EV size, concentration, and fluorescence intensity with single-particle resolution. Up to three optical detection bands enable quantitative phenotyping of EV subpopulations and their cargos.
Standardized units are reported for each measurement: size in nanometers, concentration in particles/mL, and fluorescence intensity in MESF or ERF units. This enables direct comparison across analytical systems and between researchers.
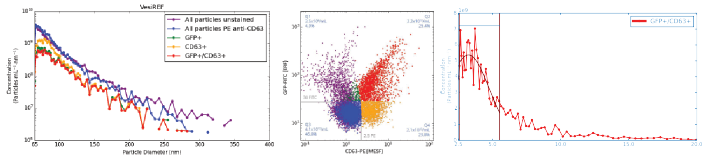
Surface Marker Quantification by Single-Particle Fluorescence
EV reference particles expressing GFP-tagged CD63 were analyzed before and after immunolabeling with PE-conjugated anti-CD63 antibodies. Particle size, concentration, and fluorescence were measured for each staining condition.
Quadrant analysis shows that nearly all GFP-expressing EVs are also positive for CD63, consistent with expression of GFP as a CD63 fusion protein. A smaller CD63-positive, GFP-negative population likely reflects EVs expressing wild-type CD63.
Subpopulation Analysis Directly in Biofluids
A major advantage of the ARC particle analyzer is the ability to perform accurate subpopulation analysis directly in complex biological matrices, such as plasma or serum, without isolation or sample cleanup.
Fluorescent 100 nm particles were spiked into plasma across a range of concentrations and analyzed directly on the ARC. As particle concentration decreased, fluorescent particles became indistinguishable from background plasma particles by size alone, but remained quantifiable by fluorescence.
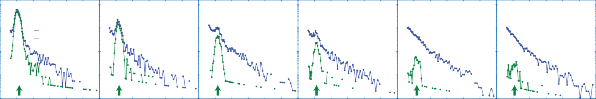
This example demonstrates the ARC’s ability to perform quantitative EV analysis directly in complex biological fluids with minimal sample preparation.