Application Guide: Lipid Nanoparticles (LNPs)
Spectradyne’s ARC™ Particle Analyzer
for Lipid Nanoparticle Characterization
Published:
Revision: V3
Overview
Spectradyne’s ARC™ particle analyzer is rapidly being adopted in QC and extended characterization workflows for fast and complete lipid nanoparticle (LNP) characterization. The ARC provides more direct and accurate measurements of LNP size, concentration, and loading than purely optical methods.
From simple measurements of nanoparticle size and concentration to in-depth studies of targeting ligand density and co-encapsulation of multiple payloads, the ARC delivers fast, reliable, and easy-to-use measurements that deepen formulation understanding and accelerate development.
How the ARC Particle Analyzer Works
Spectradyne’s ARC particle analyzer uniquely combines two orthogonal measurement techniques to yield new insights into LNP formulations.
- Microfluidic Resistive Pulse Sensing (MRPS) directly measures single-particle size and concentration. MRPS is a non-optical, electrical technique that is orthogonal to Dynamic Light Scattering (DLS), Nanoparticle Tracking Analysis (NTA), and Flow Cytometry (FC).
- Quantitative single-particle fluorescence directly quantifies encapsulated payload. Color multiplexing enables simultaneous measurement of multiple payloads, co-encapsulation, and targeting ligand density.
Gold-Standard Accuracy for Size and Concentration
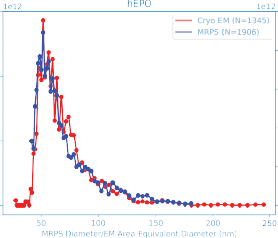
MRPS and Cryo-TEM show remarkable agreement across the full measurement range, validating the ARC’s accuracy for LNP size and concentration analysis.
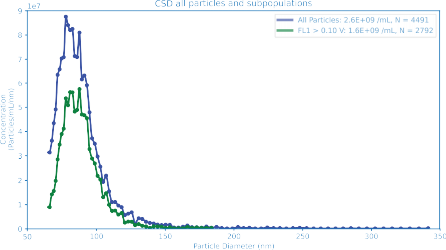
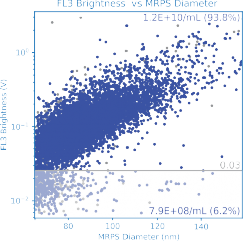
Payload Quantification (Empty / Full)
In addition to size and concentration, the ARC measures payload encapsulation on a single-particle basis. A ten-minute, no-wash staining protocol enables internal payload quantification directly as a function of particle size.
Fluorescence intensity is reported in NIST-defined units of equivalent reference fluorophore (ERF), enabling conversion to absolute numbers of molecules per particle.
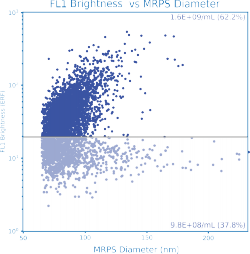
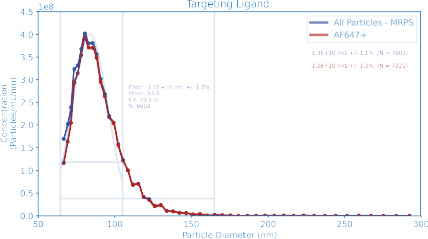
Quantifying Targeting Ligands
Functionalization of LNPs with targeting ligands is a critical development frontier. The degree of functionalization is a key quality attribute for assessing formulation performance and interpreting downstream potency assays.
In this example, LNPs incorporating Alexa Fluor 647–conjugated surface ligands were measured using red-laser excitation on the ARC particle analyzer.
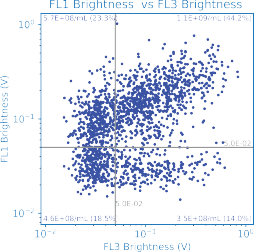
Co-Encapsulation of Multiple Payloads
As therapeutic LNP applications expand, formulations increasingly require co-encapsulation of multiple nucleic acid payloads. The relative fractions of empty, single-payload, and dual-payload particles are critical quality attributes.
Using fluorescence multiplexing, the ARC particle analyzer quantifies co-encapsulation on a particle-by-particle basis in just a few minutes.