Why trust your DLS instrument?
Spectradyne’s microfluidic technology reveals
significant challenges for other methods!
Dynamic light scattering instruments are easy to use and generate very appealing data. DLS reports data on a very wide range of particle sizes, sometimes for diameters spread over 4 to 5 orders of magnitude. You probably believe the results without question – at least if you don’t compare your DLS results with other methods!
The fundamental problem with DLS, as with other light scattering techniques, is that the signal scales in magnitude as the particle diameter to the sixth power: In other words, particles with diameters of 500 nm scatter one trillion (1012) times as much light as those with diameters of 5 nm! The Sun is roughly a million times brighter than a full moon – you have to compare the Sun to Andromeda (M31) or Ganymede, one of Jupiter’s moons, to find a brightness difference as big as this. While the software in a DLS instrument is meant to account for this extraordinary difference in brightness, very often bigger particles can erroneously dominate the particle spectra measured using DLS as well as using optical tracking.
As a result, DLS and optical tracking significantly overstates the relative number of large particles compared to small – and, in uniform distributions, will actually show peaks at the larger sizes that do not even exist, due to this problem.
Do you still trust your DLS instrument?
The Spectradyne nCS1 is the only bench top nanoparticle sizing technology that provides high-resolution size distributions and accurate concentration measurements for particles in the 50-2000 nm diameter size range. We employ a novel microfluidics-based implementation of the resistive pulse sensing method to rapidly count and size individual nanoparticles in a sample, with typical precision of a few percent in both size and concentration. As a result, the nCS1 delivers unprecedented capabilities for analyzing complex polydisperse samples. In addition, because particles are measured electrically in the nCS1, not optically, particles of all materials are measured equally well, including biological particles that have an index of refraction similar to their suspension medium.
Here we show a direct head-to-head comparison between Spectradyne nCS1’s individual particle sizing technology, single-particle optical tracking, and dynamic light scattering (DLS). Samples were prepared and sent to an independent, commercial measurement facility for analysis by optical tracking and DLS, and a small aliquot of each sample was reserved and measured on Spectradyne’s nCS1.
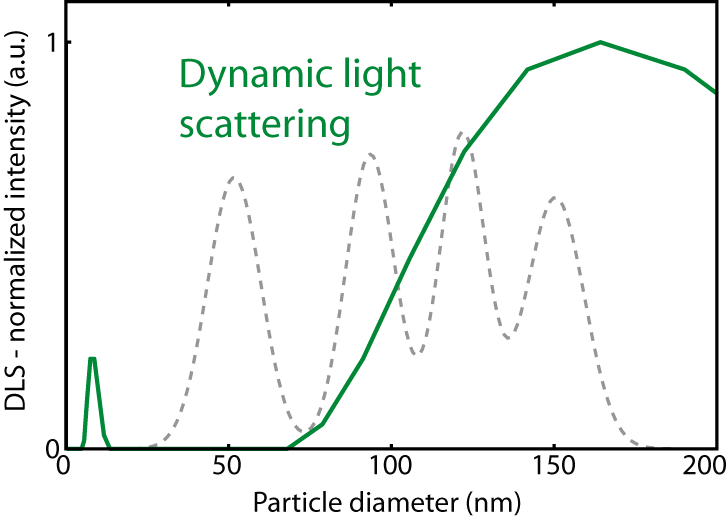
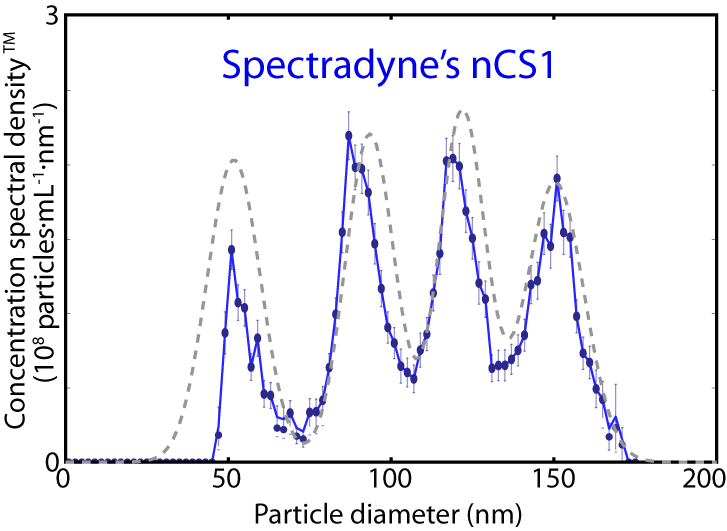
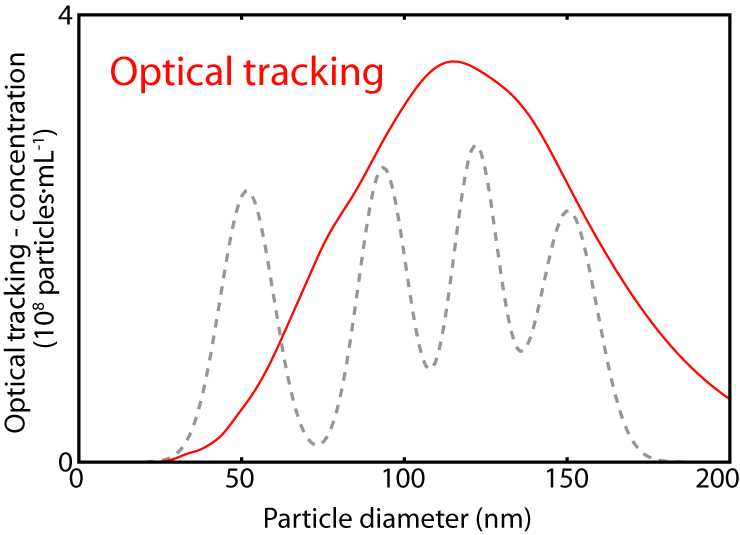
Nanoparticle suspensions having NIST-certified mean diameters 52, 94, 122 & 150 nm were mixed together to equal nominal final concentrations of 5 × 10⁹ particles/mL. Results from the three techniques are plotted side-by-side. The grey dashed line in each case shows the expected distribution. Only Spectradyne’s nCS1 clearly resolves the four components of the mixture and yields concentration measurements for each sub-population within ~ 30% of the nominal estimates given by the manufacturer. Neither optical tracking nor DLS are able to measure the true composition. Optical tracking furthermore reports a particle concentration off by a factor of three!
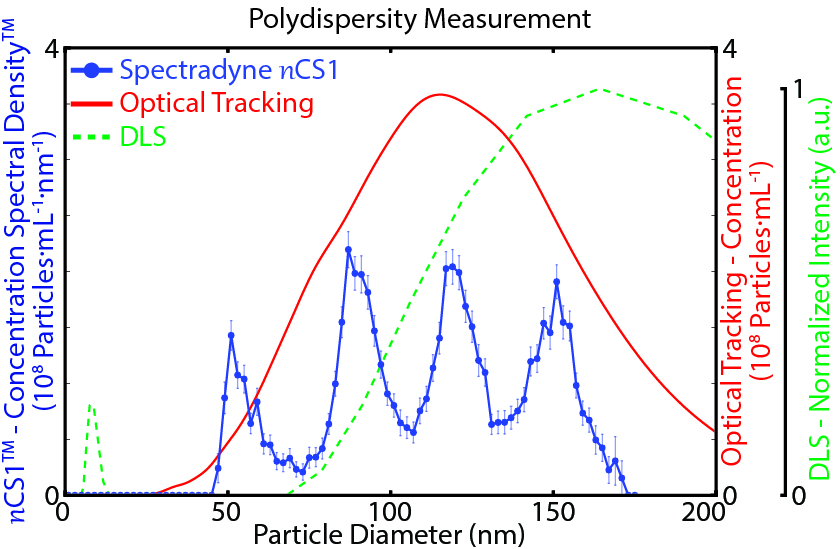
Here we compare all three methods in a single plot, showing the complete failure of DLS and optical tracking to resolve the four separate populations of particles in the synthetically generated mix, while Spectradyne’s nCS1TM clearly resolves each diameter with high fidelity measurement of each population’s concentration.
These results show that a typical DLS or optical tracking instrument has significant difficulties resolving differences in particle diameters, and also greatly exaggerate the relative population of large particles to small ones. Other measurements on samples with more uniform distributions often yield peaks in DLS measurements, even when the as-mixed sample does not have such a population of particles, and where Spectradyne’s nCS1 does not show such a peak, but instead shows a more uniform distribution.