
New: LNP Application Guide — quantifying mRNA payloads, targeting ligands, and co-encapsulation in a single run.
Get the Guide →What to Measure
Four critical quality attributes of LNP formulations
Particle size, concentration, targeting ligand density, and RNA payload each directly influence drug product safety and efficacy. Accurately characterizing all four requires a method that resolves individual particles — not population averages.
Quality Attribute 01 & 02
True LNP size distributions — and why DLS falls short

Size distributions for three LNP formulations measured by MRPS. DLS failed to distinguish between the formulations and could not measure one sample.
The limitation
DLS averages scattered light from the entire sample. It cannot distinguish between LNP formulations with overlapping size ranges, and fails entirely on polydisperse or concentrated samples.
With MRPS
Each particle is measured individually as it passes through the microfluidic constriction. The result is a high-resolution size distribution with absolute concentration at every size — no assumptions, no population averaging.
Size accuracy validated against cryogenic transmission electron microscopy (CryoTEM). CryoTEM Validation App Note →
Quality Attribute 03 & 04
Per-particle payload and ligand quantification
The limitation of bulk assays
Bulk fluorescence assays such as RiboGreen and CuBit report a population-average encapsulation efficiency. They cannot reveal how RNA is distributed across individual particles, or distinguish empty from loaded LNPs.
With the ARC
The ARC measures RNA fluorescence, particle size, and concentration simultaneously for each individual particle. A one-step stain is all that is required — no wash steps, no calibration, no multiwell titration — with results in minutes.
Workflow and data from: ARC LNP Payload Quantification App Note (PDF) →

Per-particle RNA loading for three LNP formulations. Formulation C carries significantly less RNA per particle than A and B; formulation A shows the highest median loading.
Method Comparison
How MRPS and F-MRPS compare to DLS and NTA for LNP work
No single technique answers every question. The table below summarizes where each method excels and where it falls short for lipid nanoparticle characterization.

Resources
LNP application notes and technical guides
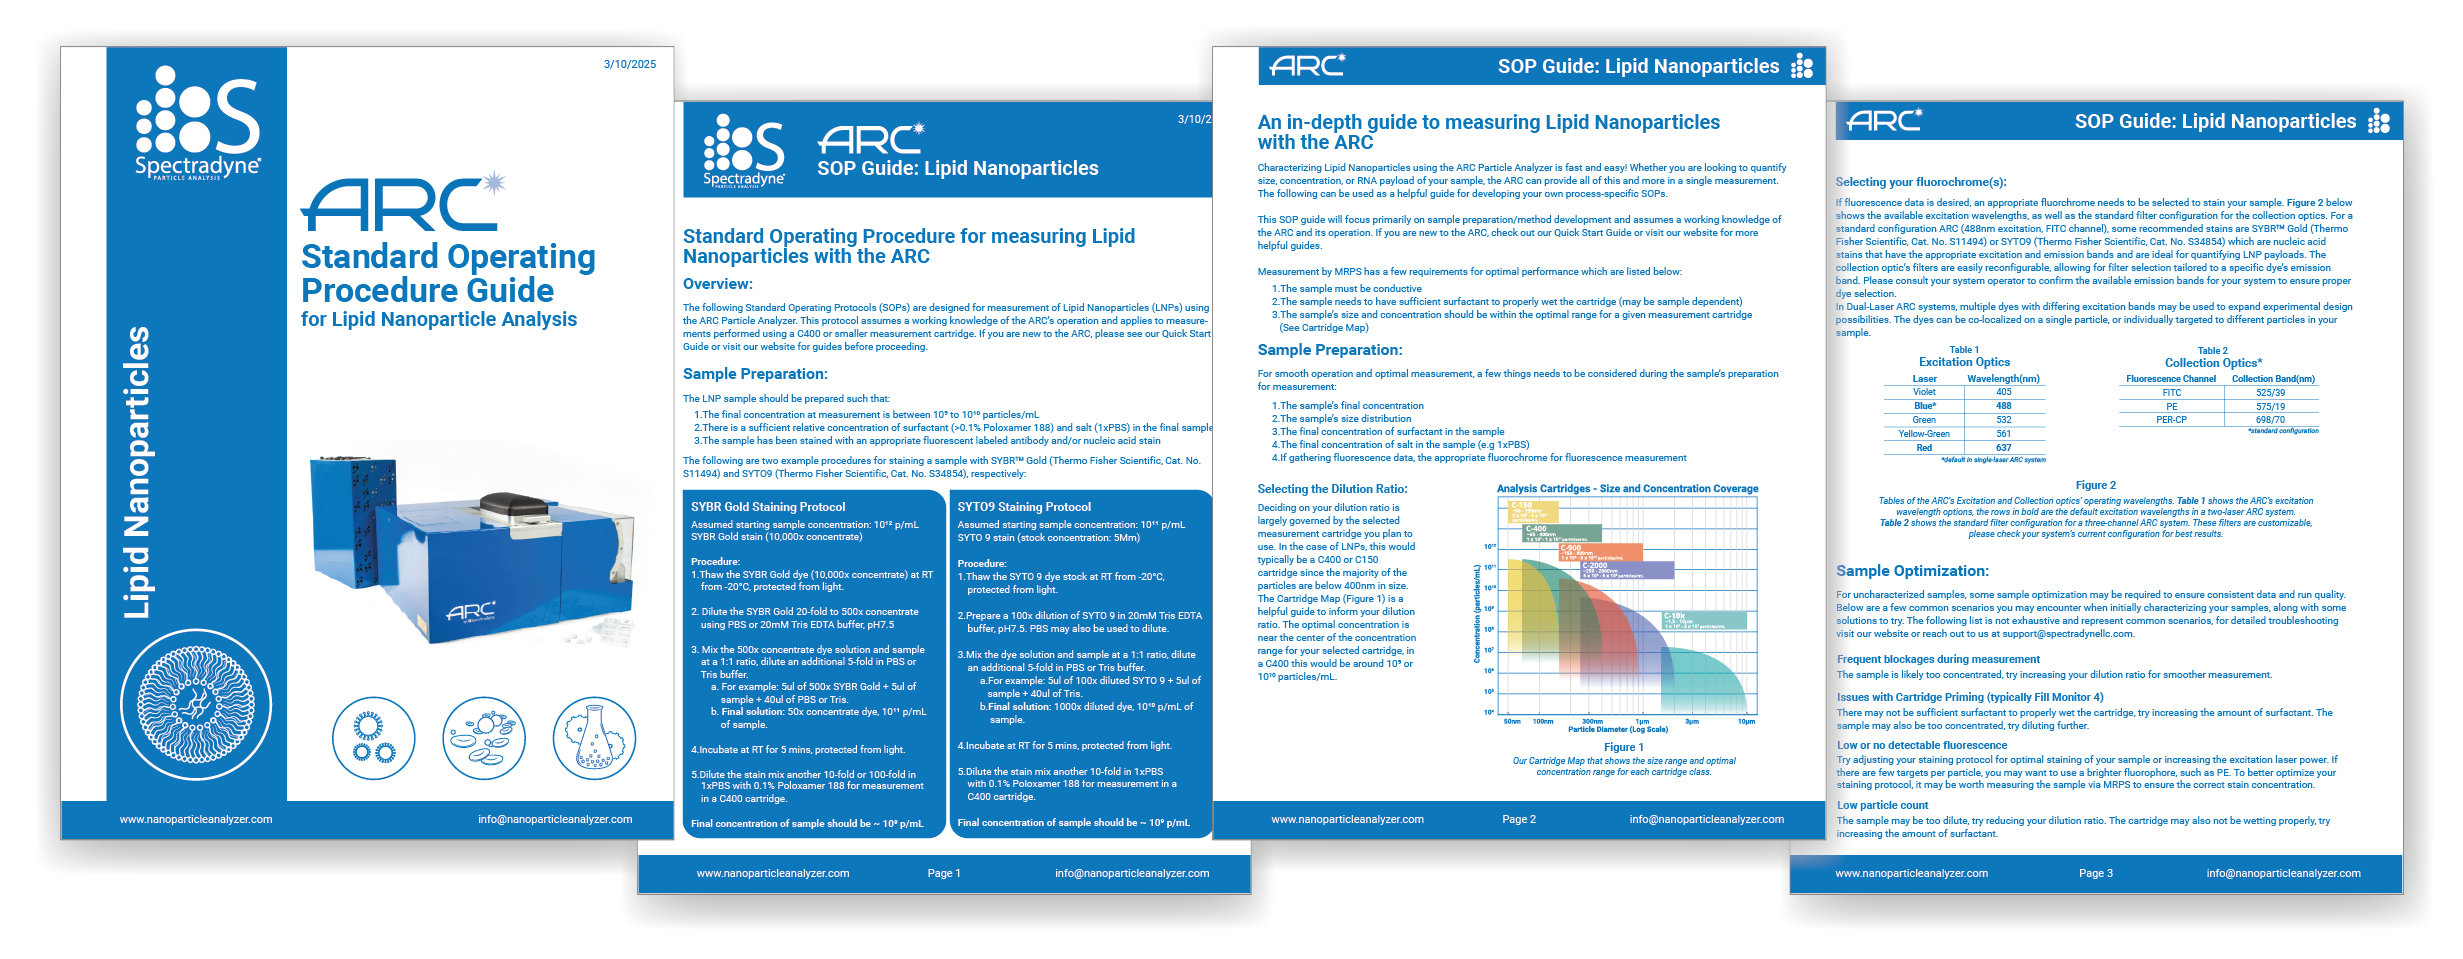
Standard Operating Procedure
LNP Measurement SOP Guide
Step-by-step measurement protocols for lipid nanoparticle analysis on Spectradyne instruments.
Ready to characterize your LNP formulations?
Submit a sample for a free measurement, or schedule a live demonstration with one of our applications scientists.