June 10, 2022 – Dynamic concentration analysis – An improved method for calculating concentration by MRPS
Here we describe Spectradyne’s deployment of a new and improved method for calculating nanoparticle concentrations measured using our microfluidic resistive pulse sensing (MRPS) instruments.
The fundamentals – How does MRPS determine concentrations?
- MRPS counts and sizes nanoparticles one by one as they flow through a sensing constriction in the microfluidic cartridge — learn more at our technology page
- Concentration is the number of particles per unit volume, so to calculate concentration from raw counts requires knowing the volume of analyte in which the particles were counted.
- In MRPS, two parameters are used to determine sample volume:
- A factory-calibrated conversion factor to calculate sample volume from the speed of the sample as it flows through the sensing constriction
- The speed of the sample flow, which is determined from the average transit time of particles as they pass through the constriction — see the figure below:
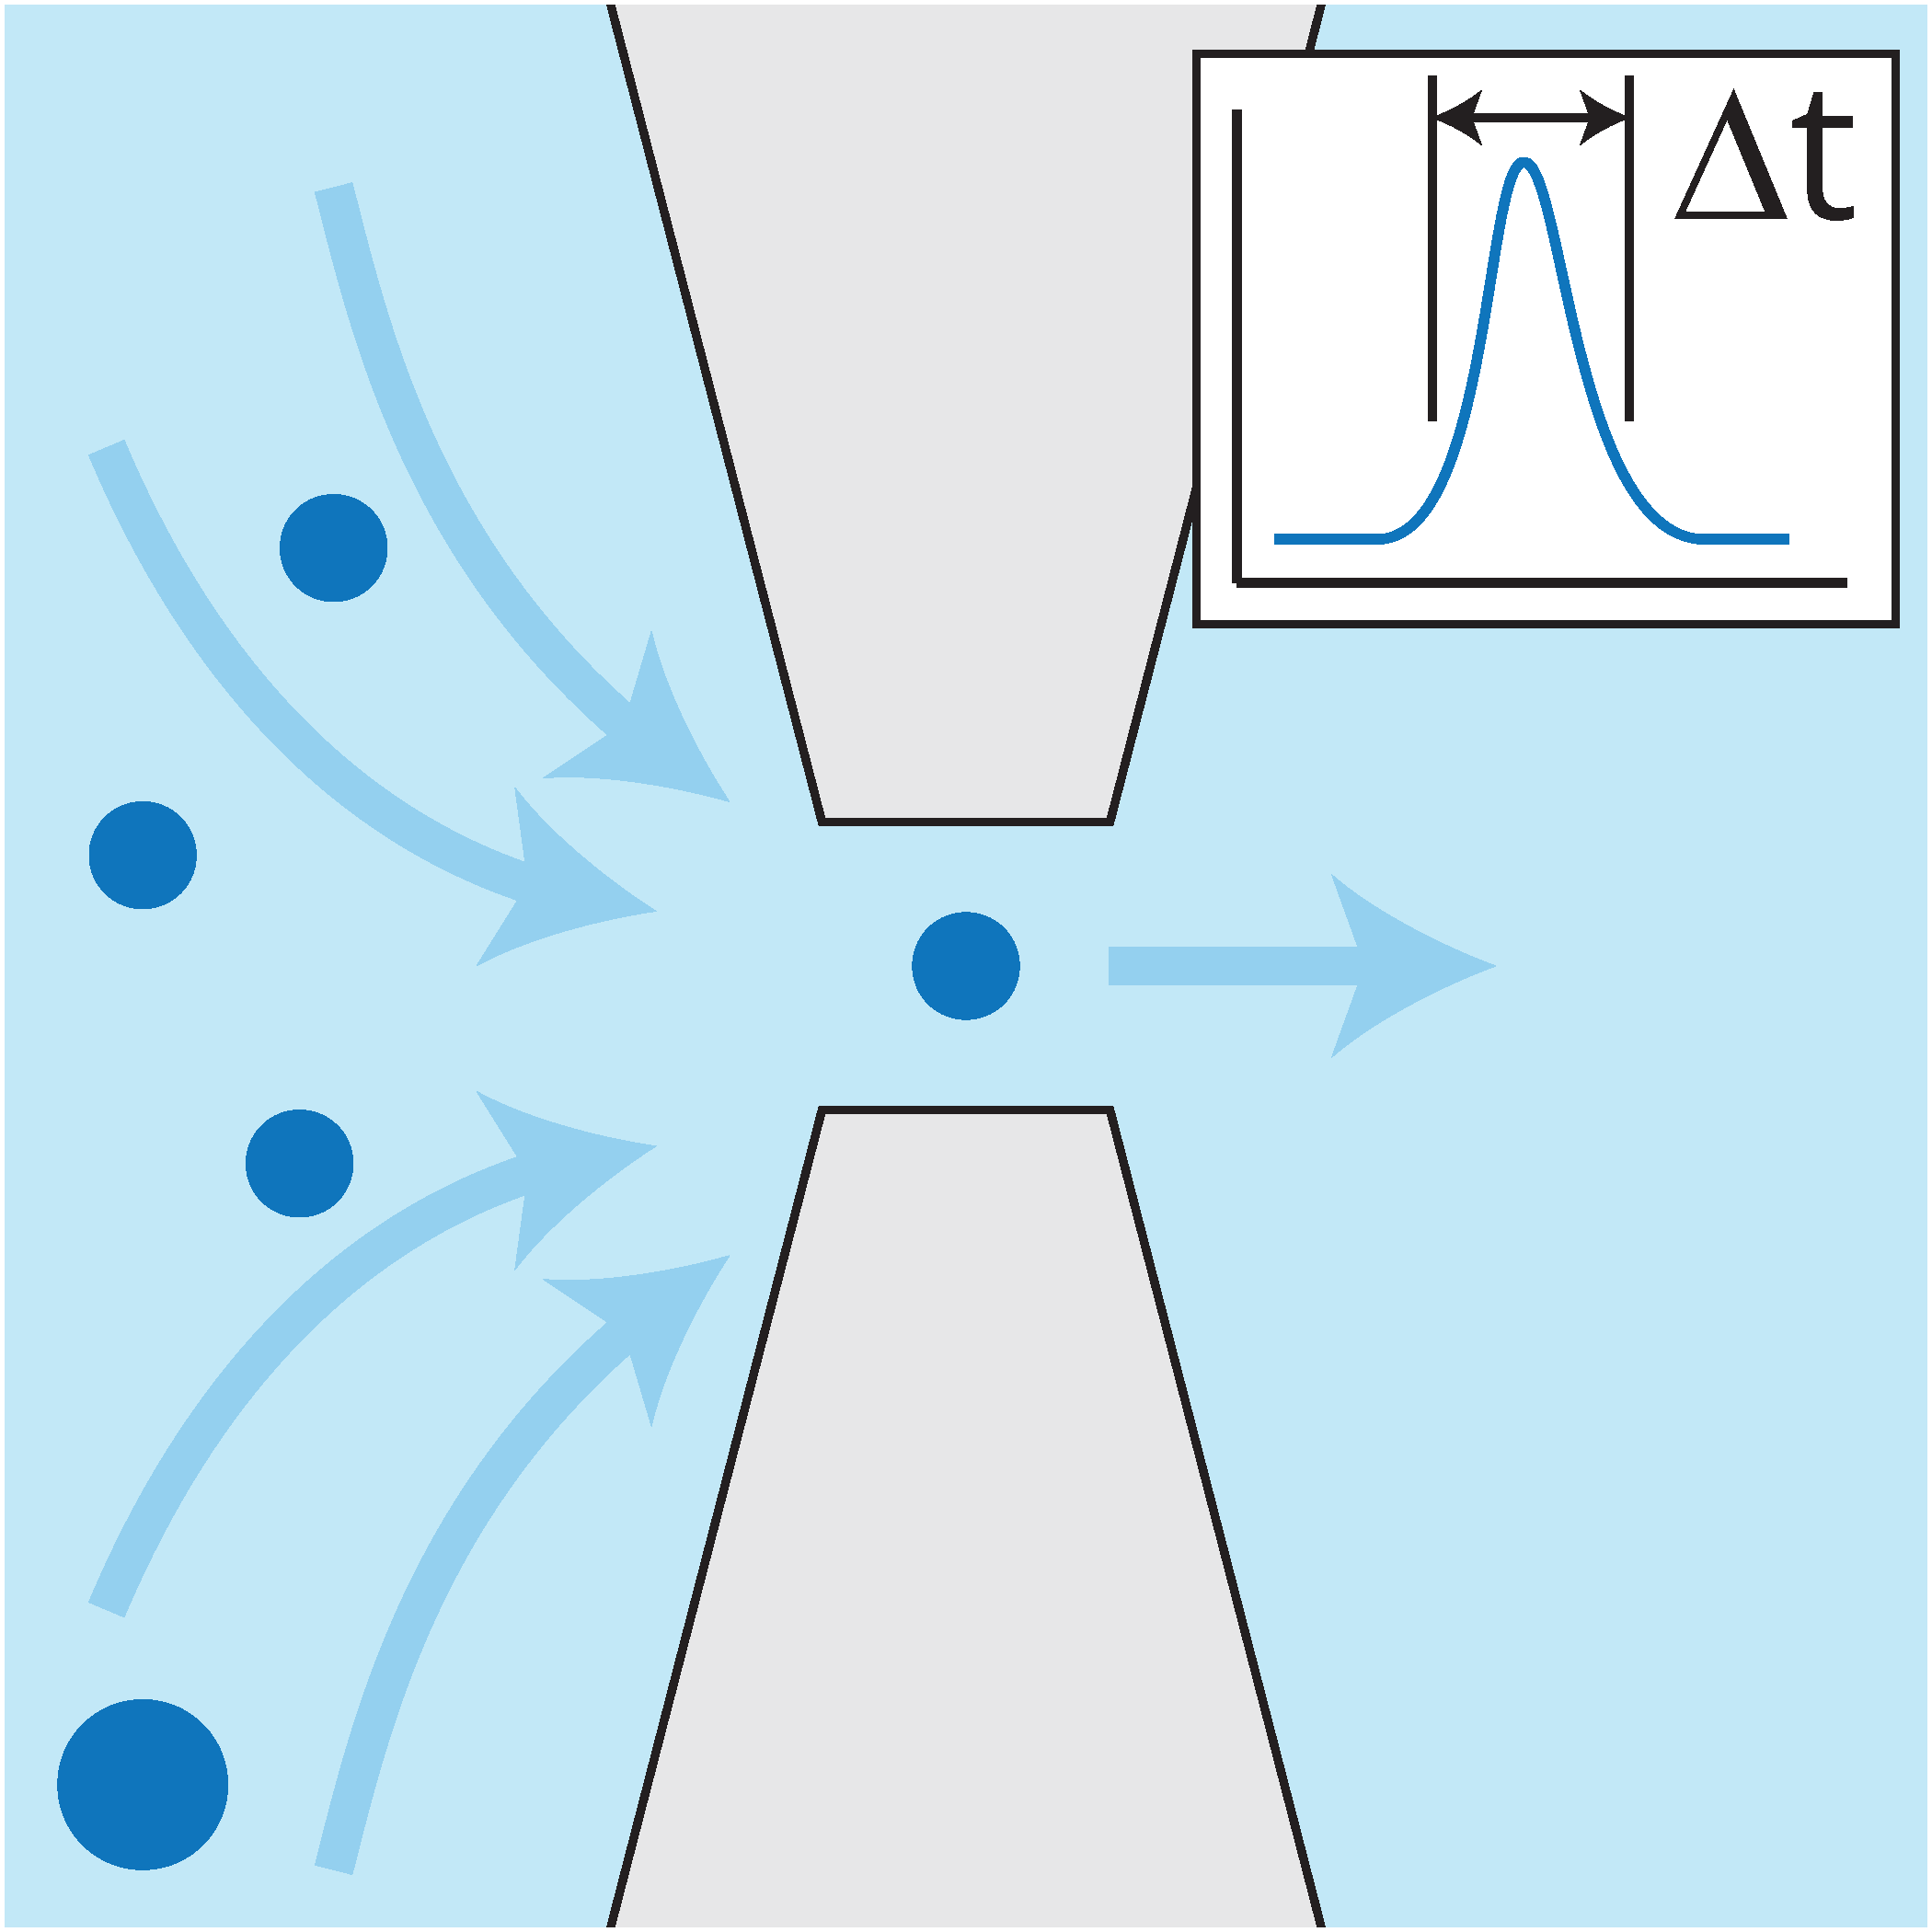
Schematic of a particle transient, giving the particle transit time.
So what’s new? The set of particles used to calculate the sample speed
- The average particle transit time calculation depends on which events are included in the average
- Old method:
- Rigid parameters set the particle events used to calculate sample volume. This worked well in most applications!
- New method:
- The applied peak filters set the particle events used to calculate sample volume. See the lower image to the right. This is better in all applications!
- As the filters are changed by the user, the concentration is updated dynamically.
- In most applications the default filters — which are automatically applied at data processing — will do the best job of accurately determining the concentration. No action is required by the user.
- In special situations when custom peak filters are required to completely exclude false positive events, the concentration accuracy will be improved after the peak filters are applied.
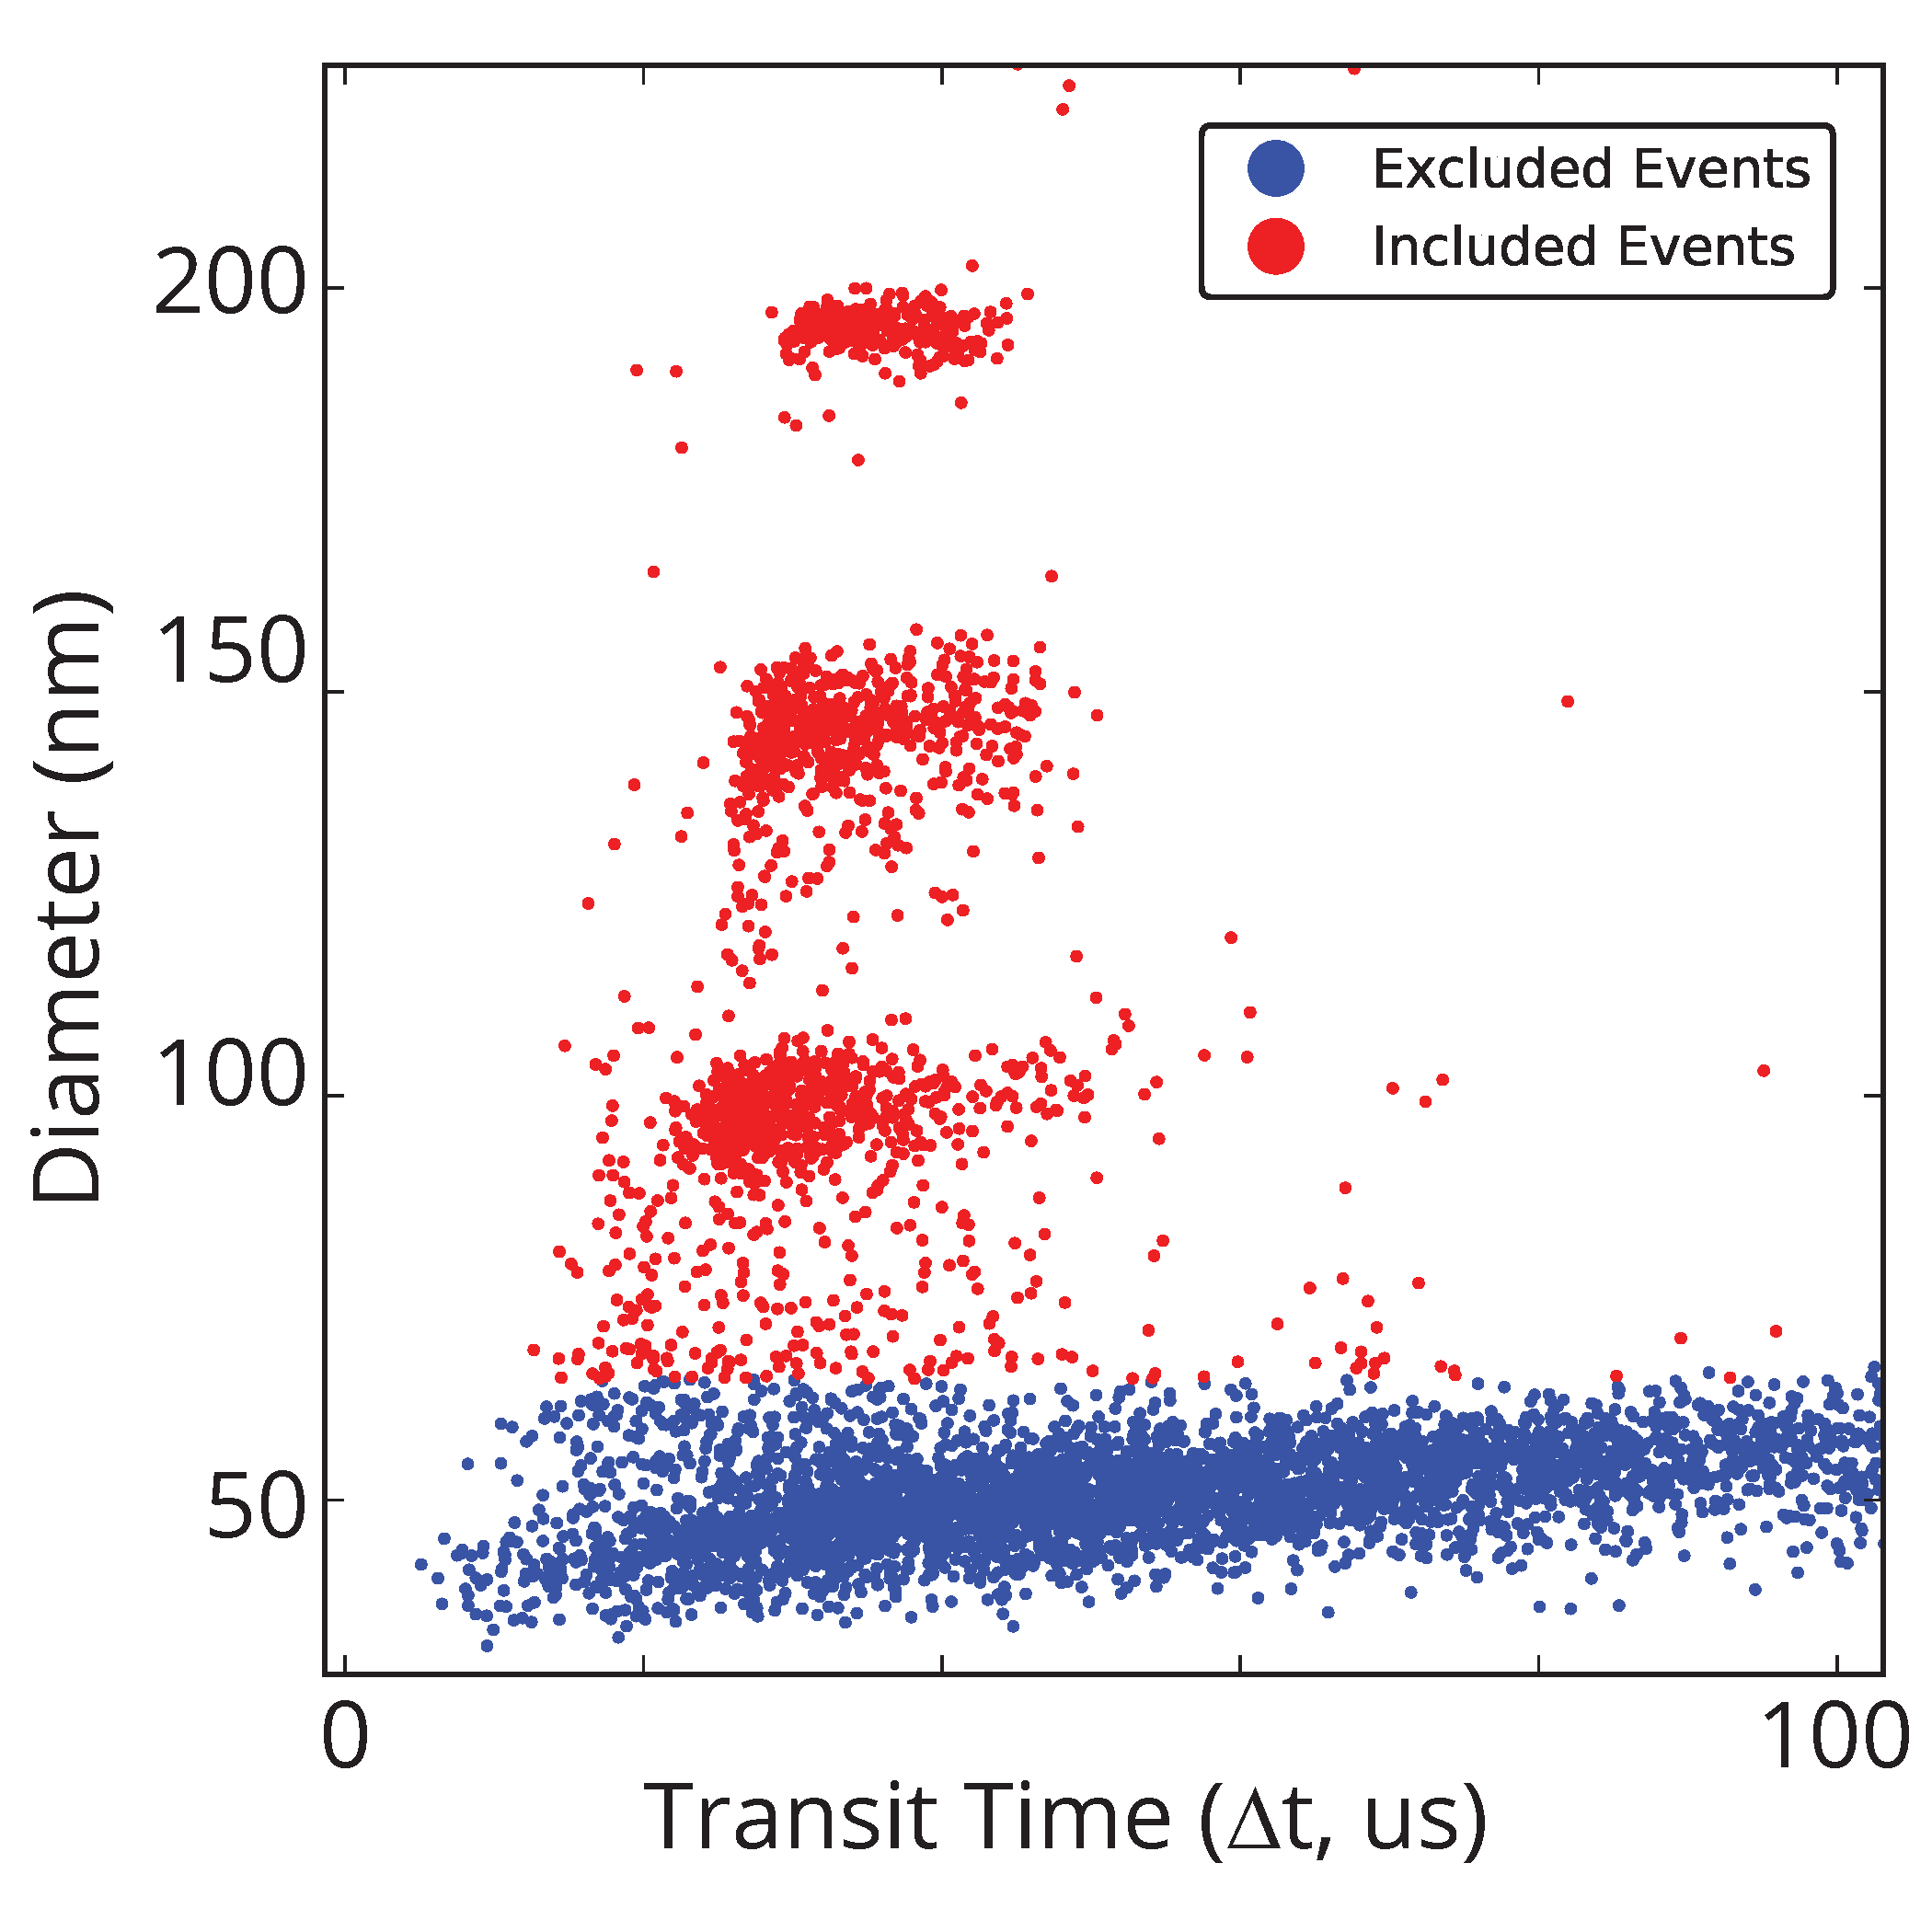
Example of particle selection used for calculating concentration.
What does this mean for users of Spectradyne’s technology?
- More accurate and robust concentration measurements for any stats and combined files generated with Spectradyne Tools version 2.5.0.314 or later.
- Stats and combined files created prior to the upgrade will not be changed by the new analysis method.
- Raw data collected using cartridges with a box date after 11/1/2021 is eligible for reprocessing using the new method.
- It’s always good practice to ensure that the peak filters applied to the data are correctly excluding any false-positive events and deliver an accurate assessment of the real particles in the sample.
From sunscreen to liquor to the COVID vaccines, nanoparticles are all around us — let’s keep measuring!