Key Application Notes
See real-world examples of the power of our technology
Explore our key application notes to discover how the ARC Particle Analyzer can enhance your particle analysis processes. Each application note provides detailed insights into specific use cases, methodologies, and results obtained using our state-of-the-art particle analyzers. Whether you’re in pharmaceuticals, materials science, or any other industry requiring precise particle analysis, our notes will guide you through optimizing your workflows and achieving accurate results.
Read our overview of the technology, check out our specifications, as well as our comparative head-to-head comparison with other technologies.
Watch a video presentation that gives an overview of Spectradyne’s technology.
Lipid Nanoparticles and Nanomedicine
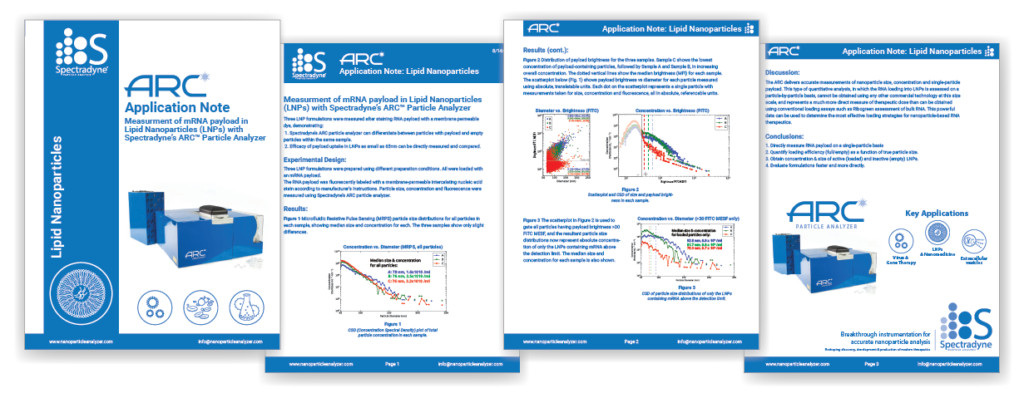
Lipid nanoparticles and nanomedicines are nanoparticle-enabled therapeutics. At this size scale, the size and concentration of the nanoparticles themselves directly impact the performance of the overall product: Size determines payload capacity and diffusion rates, (e.g. bioavailability) and concentration represents the total amount of drug in the formulation, namely the dose. Size, concentration, and payload therefore represent three critical quality attributes that must be accurately measured to ensure safety and efficacy of nanoparticle-based therapeutics such as lipid nanoparticles and nanomedicine.
Read about measurements of LNPs using our technologies.
Extracellular vesicle analysis
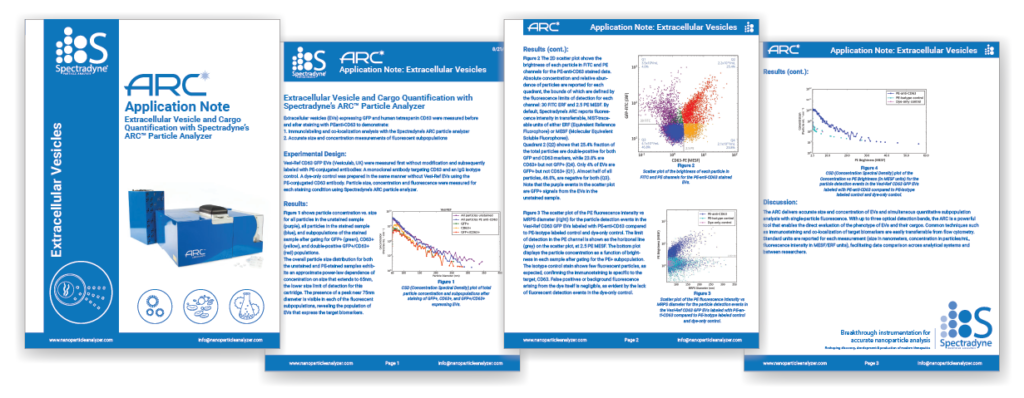
Extracellular vesicles can be especially difficult to measure, in particular when attempting to use optical techniques, due to the poor index contrast these provide with water or other suspending fluids. The nCS1TM and ARCTM provide clear and strong signals even for vesicles down to 50 nm in diameter. Accurate quantification is critical for assessing the purity and biological activity of extracellular vesicles (EVs), and for understanding EV-mediated mechanisms of intercellular communication. EVs present very low optical contrast with their surrounding aqueous media however, so scatter light very weakly, and present an inherent difficulty for accurate quantification by any light scattering-based technique including Nanoparticle Tracking Analysis (NTA). Spectradyne’s nanoparticle analyzers use an electrical (non-optical) method for accurately counting and sizing individual EVs and agrees very well with TEM, the gold standard technique. In the ARC, this capability is combined with individual particle fluorescence phenotyping.
Read about our extracellular vesicle capabilities.
Virus and Gene Therapy
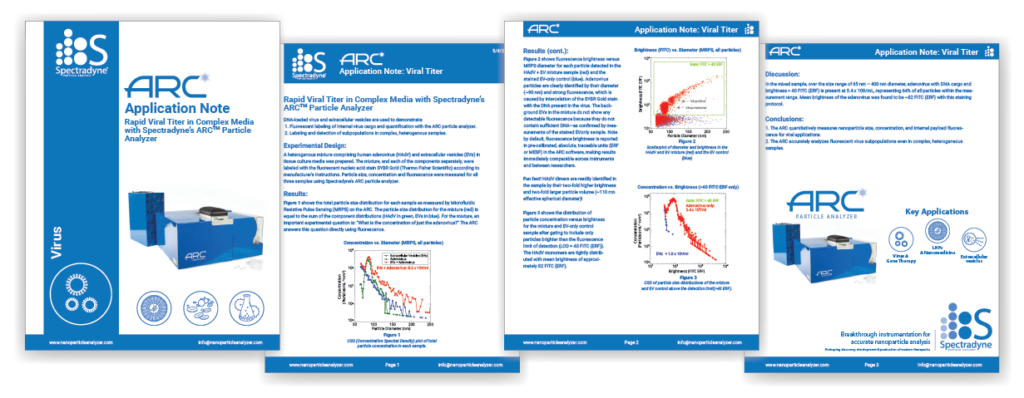
Viruses are biological nanoparticles that are used in a variety of applications. In addition to their well-known use in vaccines, viruses are being developed as therapeutics for disease, and serve as a convenient means to transfer genetic information. In many applications, an accurate measure of the concentration (titer) of the virus is required. This is difficult or impossible to do using conventional methods such as dynamic light scattering (DLS) and optical tracking, where the small size and low optical index contrast make detecting virus quite challenging. Furthermore, DLS does not give concentration information. Spectradyne’s nCS1TM and ARCTM can easily detect virus down to 50 nm in diameter, yielding accurate concentration data. In Spectradyne’s ARC, this capability is combined with individual particle fluorescence phenotyping.
Read about measurements of virus.
Spectradyne’s nCS1TM and ARCTM versus DLS and NTA

Dynamic light scattering (DLS) and nanoparticle tracking analysis (NTA) both use light scattering to monitor particle Brownian motion, which combined with estimates of solution viscosity can be used to provide an estimate of the hydrodynamic radius of particles. These indirect methods are appealing because they only require probing a sample with light, requiring very little sample preparation. However, these methods are in fact prone to large systematic errors and both DLS and NTA can generate particle size distributions that are quite misleading and incorrect. Resistive pulse sensing as used by Spectradyne’s nCS1 and ARC instead measure the individual diameters of each particle, so the particle size histograms provide quantitative, high resolution measurements of both particle diameter and absolute concentration.
There are in fact direct comparisons of DLS and NTA to the gold standard measurement of individual particles by electron microscopy (EM), with comparisons in the published literature showing that both DLS and NTA present “false peaks” in their reported distributions that do not match the EM results.
Read about our head-to-head comparison with other technologies, our overview of the technology, and read our specifications.