Optical methods for particle size analysis
Light scattering methods for particle size analysis include dynamic light scattering or DLS, which is a bulk measurement technique, and nanoparticle tracking analysis or NTA, which tracks individual particles as they move due to Brownian motion in the suspending fluid. These are each described below.
Dynamic light scattering (DLS)
Dynamic light scattering (DLS) is a technique that measures large populations of particles (it is not a single particle-by-particle technique). A laser is used to illuminate the fluid sample in which the particles are suspended, and the laser light scatters off the particles. Because the light from a laser is coherent, the scattered light from different particles interferes and creates a projected pattern of light and dark regions (called a speckle pattern). Photodetectors off to the side of the laser axis are used to catch and monitor the time dependence of this speckle pattern, where software generates from these data the scattered light auto-correlation function. By analyzing the time dependence of the auto-correlation function, in particular the time dependence of the decay in the correlation of light, the size of the particles can be inferred using the physics of Brownian motion.
The mathematics behind this analysis is complicated, and many assumptions are made to arrive at the final result, which works best if the sample is monodisperse, meaning there is only one size of particle in the sample; it works much less well if the sample is a mixture of different particle diameters. Part of the problem is that larger particles scatter much more light than small particles; the amount of scattered light scales as the sixth power of the diameter, D6, so a particle with twice the diameter scatters 64 times as much light, and thus dominates in the analysis of the sample. DLS also works best if the sample has a low particle concentration, so the laser only scatters on average once off a particle before reaching a detector.
DLS requires little sample preparation, and the instrument is a benchtop tool. However, interpreting what the measurement reveals about the sample is fraught with uncertainty, and can be very misleading. As often little is known a priori about the actual distribution of particle sizes in the sample, using DLS with no orthogonal method is highly risky.
Read here to see how DLS compares to Spectradyne’s MRPS technology.
This application note will tell you about false peaks in DLS measurements.
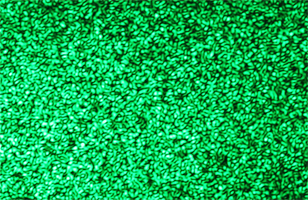
A laser speckle pattern.
Nanoparticle Tracking Analysis (NTA)
Nanoparticle tracking analysis (NTA) is very similar to dynamic light scattering or DLS; it is essentially its single-particle cousin. A special sample holder is filled with the fluid sample in which the particles are suspended, and a laser illuminates the sample at grazing incidence. The light scattered off the particles is collected by a microscope objective and projected onto a imaging electronics such as a CCD. Each particle forms an image on the CCD, and the motion of each particle is tracked as a function of time. The random Brownian motion is extracted from a time series of images, and from the physics of Brownian motion, the diameter of the particle (known as the hydrodynamic diameter) can be calculated, if the viscosity of the sample is known.
The method is simple and requires little sample preparation. This works well for particles in the size range of roughly 100 nm up to 1 μm (1000 nm); particles smaller than about 100 nm in diameter scatter significantly less light (the amount of scattered light scales as the diameter D to the sixth power), so smaller particles tend not to be detected, and particles larger than about 1 μm don’t move enough (their Brownian motion is too small) for their diameters to be extracted from the images. A single sample will yield a limited amount of information, as only a few hundred particles at most can be monitored at the same time; several sequential measurements are needed to get enough statistics to reliably report the particle concentration versus particle size. The sample holders are non-disposable and must be cleaned after each use to prevent sample cross-contamination.
The NTA method suffers from a curious problem known colloquially as the false peak problem. As the particle sensitivity to small particles falls as the sixth power of the diameter, the NTA will report a distribution that cuts off below a certain diameter, creating a false peak in the distribution. Using an orthogonal method can reveal this false peak, and is highly recommended for measurements where knowing the actual size distribution is important.
Read more about nanoparticle tracking analysis.
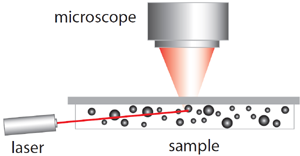
Diagram of the measurement setup for NTA.