
Many people look at our particle concentration graphs and ask "why is the vertical axis in units of particles/mL/nm? What does that mean?" We call these distributions Concentration Spectral Density (CSD); this represent the number of particles per unit sample volume (measured in mL) per unit particle diameter (measured in nm). By including the "per unit particle diameter" part, one creates a histogram that is already normalized by the bin size, meaning that this histogram can be easily compared with other histograms. If you want to calculate the absolute concentration of particles in a range of particle diameters, you integrate (in other words, sum) over the desired range, generating a size histogram with the bin widths you desire. That summed result would be a histogram of the number of particles per ml for the bin size you chose.
Back to table of contents
If you encounter a particle size distribution that only uses particles/mL on the vertical axis, then the data has already been binned for some defined bin size (and you may not know what that size is without further digging). If you want to compare this binned distribution with another distribution, you have to find out what bin size was used for each distribution, as the concentration at any point on the graph (the vertical axis value) depends on the bin size that was used.
We use CSD at Spectradyne so that we can quickly and easily compare results from multiple runs/samples/cartridge sizes directly, without having to worry about bin size and without having to do any conversions. Note that the CSD is in this way not only independent of bin size, but it is also independent of the cartridge parameters used for the measurement. The plot shown to the right illustrates this, showing two different samples that were each run in two different size cartridges, and yet the results are immediately comparable in the software without further calculations. Note the cartridges each cover a different nominal size range, allowing us to cover almost a 100-fold range in particle diameter (a million-fold range in particle volume!), yet the measurements overlap very well where the cartridge ranges overlap. Note also that the cartridges only use 3 μl of sample. You can read more about our cartridges here.
If your particle analyzer is not plotting CSD, ask the vendor why! You will need to understand how their data is binned in order to make valid comparisons of distributions. At Spectradyne, we take care of all of that for you, by always using CSD.
Spectradyne's technology is affordable, easy to use, and easy to adopt. Want to learn more about how it saves researchers' time? Visit our applications page here.
Please continue to follow our blog as we share insights, technical details, and generally geek-out with you about nanoparticle science!
Email us for more information, or to discuss your particular application directly.
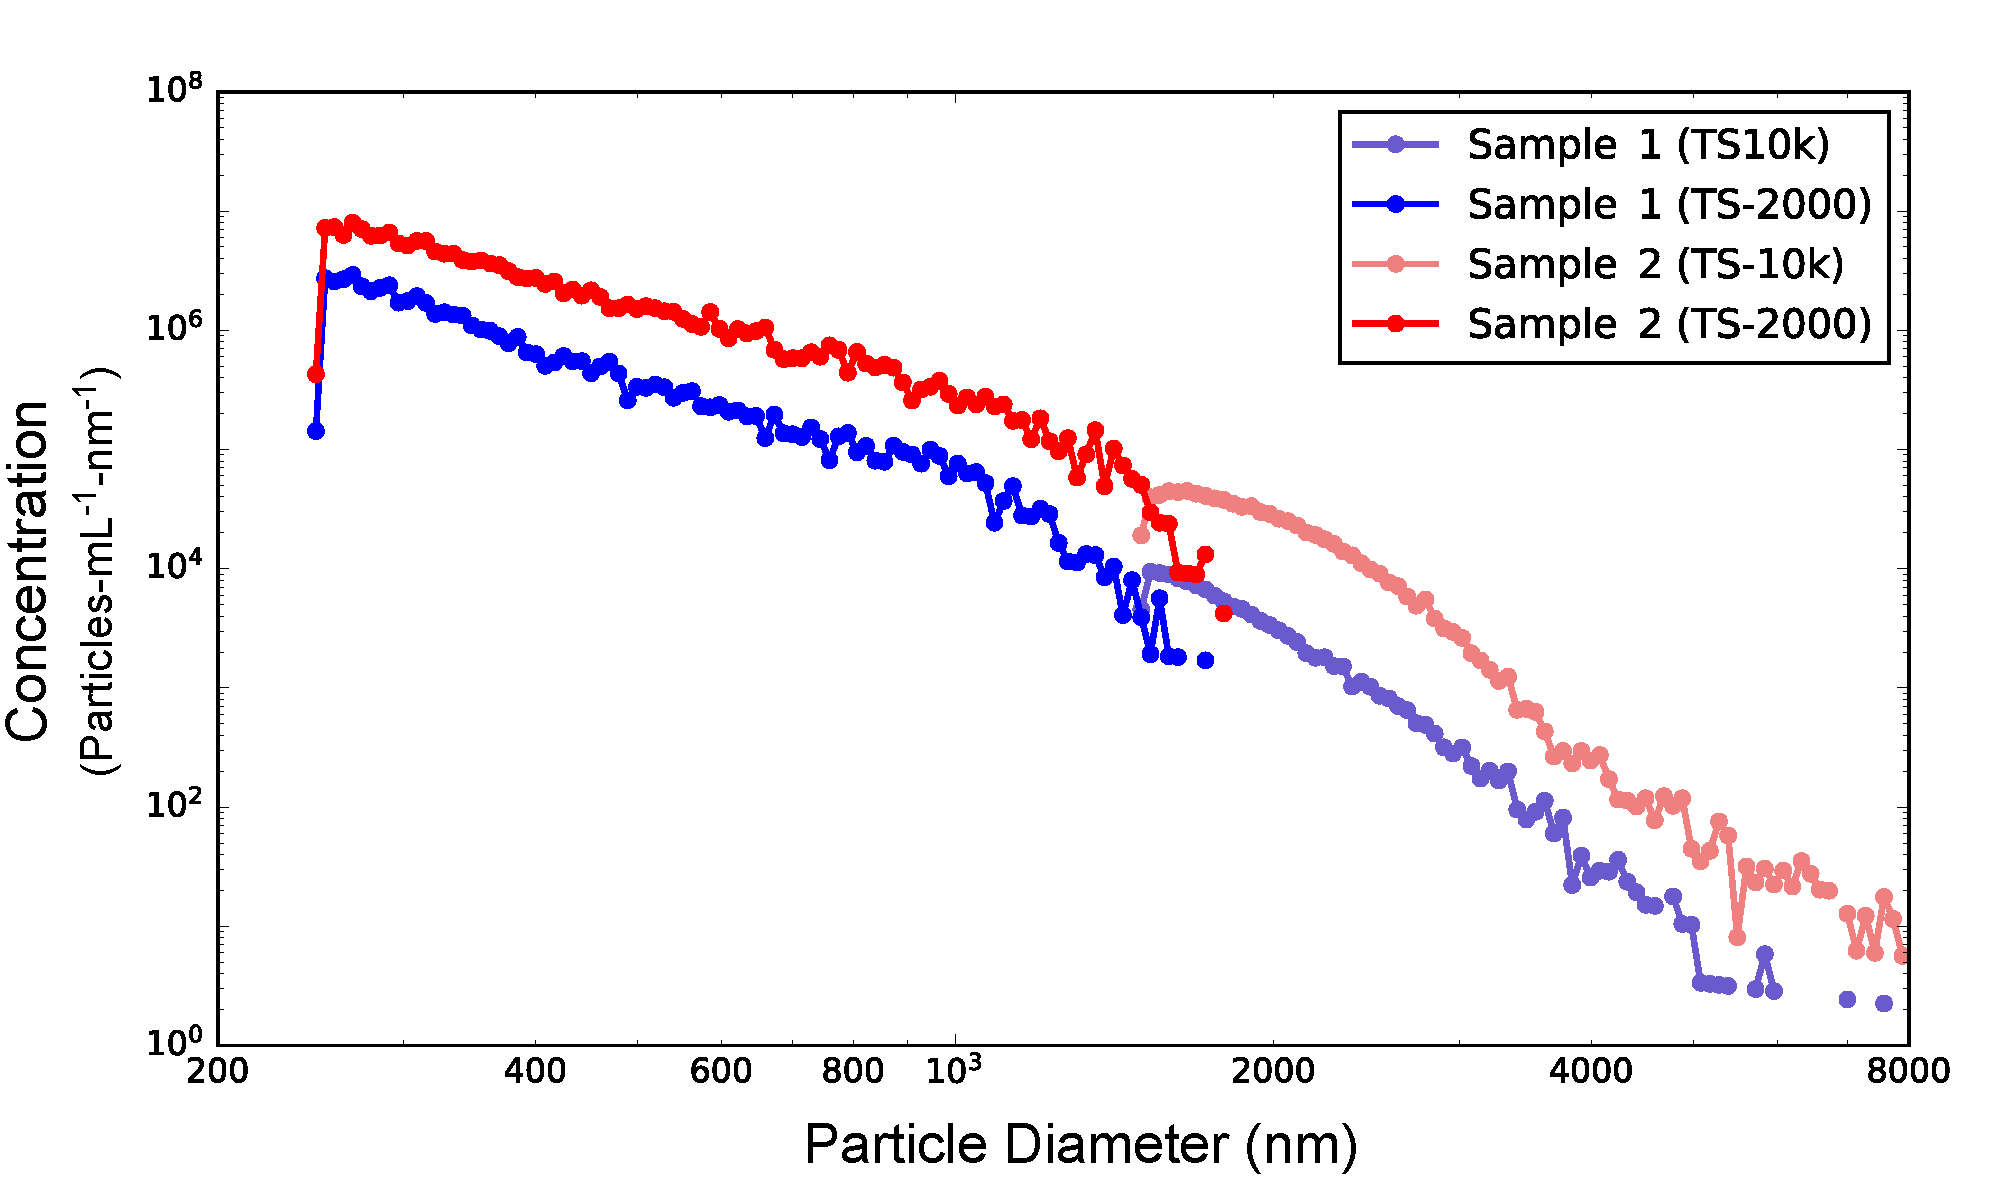
Figure showing measurements of two different samples, each measured in two of Spectradyne's disposable microfluidic cartridges.

Spectradyne is a world leader in the microfluidic measurement of nanoparticles.
Nanoparticle analysis using resistive pulse sensing avoids many of the difficulties associated with DLS and optical tracking. Spectradyne is the only company providing microfluidic particle size analysis, now combined with single particle fluorescence.
Check us out today!