
In our last post we dealt with the thorny issue of false peaks in the measurement of extracellular vesicles, especially as exemplified by NTA-based measurements of those vesicles. These false peaks are tantalizing because they often occur at a size range where researchers might expect to see a peak in a well-isolated exosome sample. Back to table of contents
We also pointed out that the "limit of detection" (LOD) issue that causes the false peaks is very much NOT limited to measurements of exosomes, specifically, or even biological nanoparticles, generally. In fact, erroneous NTA measurements are readily apparent simply by making careful measurements of polydisperse mixtures of polystyrene beads (see our
tech brief for more information). The core issue is that large particles scatter far more light than small particles so the detection of smaller particles will always be obscured (to greater or lesser extent depending on user settings, which is another issue we won't discuss here) by the scatter from larger particles. It's really no different from the difficulty one has trying to see, and count, faint stars in a night sky next to a bright moon or in the presence of light "pollution" from a nearby city.
As a reminder, to the right we show the data given in the earlier blog post about exosome detection.
The cryo-TEM and Spectradyne nCS1 measurements agree extremely well from 50 nm to 400 nm whereas the NTA measurement undercounts particles below 250 nm, and dramatically so below 130 nm.
Of course, exosomes are just one type of biological nanoparticle, so let's make this more interesting. As we said earlier, similar data can be obtained for protein aggregates, as shown in the second plot to the right.
These measurements were taken on-site at a customer demo, with the NTA data collected by the customer directly. Two cartridge sizes (TS-400 and TS-2000, read more about the microfluidic cartridges
here) were used for the nCS1 measurement and there is excellent agreement in the overlap region just above 200 nm. Let's set aside differences in the absolute concentration levels, since we have no independently verifiable measure of it. More important, and more striking, is the different shape in the two distributions. Whereas the nCS1 data, in blue, shows a rapidly increasing concentration of particles as their size decreases, the NTA data shows a peak in the distribution at around 130 nm.
Unfortunately, in this case we don't have a third orthogonal measurement like cryo-TEM to verify Spectradyne's measurement, but hopefully we have explained how this false peak phenomenon happens-it's exactly the same as in the EV measurement shown earlier! (For more info, you can read our tech brief.)
Another way to think about the protein aggregation result is to step back and consider why, really, there would be a peak around 120 nm in a protein formulation? The monomers, dimers, etc. are far smaller than this, and we know of no naturally occurring phenomenon that would lead to a population maximum at this size. A far more likely explanation is that the peak is an artifact of the metrology. As an aside, the reason we cut off the nCS1 data at 60 nm is that the nCS1 measurement loses sensitivity below 60 nm: as we've emphasized before, all metrologies have their limits of detection. Spectradyne is different in that we make no claims about things we know we can't measure, unlike many of our competitors!
Most scientists we talk to in the biopharma community accept this false peak interpretation when we review this kind of data with them. We've seen it many times, and our ability to educate the community on the correct interpretation of aggregation data has contributed to our success in deploying the nCS1 instrument, giving researchers an early indication of formulation instability. By making highly accurate measurements of protein aggregates, Spectradyne's Microfluidic Resistive Pulse Sensing (MRPSTM) technology saves companies time and money. With only 3 μliters of sample, one can detect aggregation far earlier than one can using conventional techniques. And, as a bonus, we'll help you understand the fundamental limitations of the measurements, unlike other instrument manufacturers.
Please continue to follow our blog as we share insights, technical details, and generally geek-out with you about nanoparticle science!
Email us for more information, or to discuss your particular application directly.
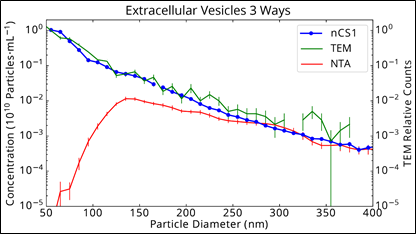
Urinary vesicle exosomes measured by NTA
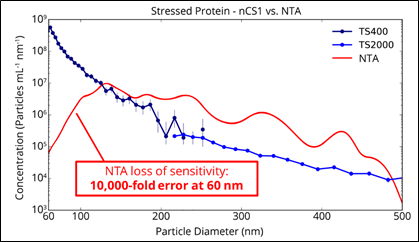
Comparison of measuring a stressed protein sample with the nCS1 and with NTA

Spectradyne is a world leader in the microfluidic measurement of nanoparticles.
Nanoparticle analysis using resistive pulse sensing avoids many of the difficulties associated with DLS and optical tracking. Spectradyne is the only company providing microfluidic particle size analysis, now combined with single particle fluorescence.
Check us out today!