

In this blog, we often talk about the importance of orthogonal measurements, especially if all one has is metrology based on light scattering (e.g. DLS, NTA). This admittedly serves Spectradyne's purposes well because, after all, our technology is an electrical one and it's inherently orthogonal to measurements based on light scattering! Back to table of contents
However, another critically important feature of our MRPS technology is that it measures particles individually as they pass through a sensing volume, so that a measurement of one particle does not affect that of another (within certain limits on concentration, of course). This means that Spectradyne's nCS1TM can measure an arbitrarily polydisperse sample just as easily as it can measure a monodisperse one.
To understand this better, let's back up and make sure we understand what is meant by an "arbitrarily polydisperse" mixture. It's an odd phrase, really, and one that perhaps Spectradyne invented. The meaning we are trying to convey is simply that Spectradyne's MRPS technology can measure accurately a mixture that has ANY mix of particle size and concentration. Let's illustrate this with a beautiful plot of a four-component mixture of polystyrene beads, seen at right.
We see four distinct populations in only 100 nm of size range! Moreover, the concentration is readily reported separately for each sub-population. Now, there are of course resolution limits with Spectradyne's technology, as there are with any measurement technology. If two of the peaks were, say, only 5 nm apart instead of 20 nm apart, we wouldn't fully resolve them. But this resolution limit, related to the size measurement uncertainty of each reading, can be specified and understood from measurements of a monodisperse sample, if one is so inclined. It's not caused by the polydispersity of the sample.
Let's look at what happens if an instrument does not have the core property of independence of measurements, as the nCS1TM does. At right we see a NTA measurement of some 208 nm polystyrene beads. It's a nice plot. (Note that in this and the following data presentations we'll just use normalized concentration units, referenced to the 208 nm measurement, for simplicity.)
Let's look at a couple more measurements of monodisperse bead samples, 94 nm and 150 nm, and plot those separate measurements on the same axes as the 208 nm one. This combined plot looks great too - the measurement method is clearly working well.
But what happens if we put all three bead populations in the same mixture, and try to measure that polydisperse mixture? Well, as we see in the third NTA measurement, the wheels kind of fall off the cart. We see that the concentration measured for the 150 nm beads is somewhat suppressed, maybe by 15%. But the poor 94 nm beads disappear completely!
What happened? We hope you believe us that the 94nm particles are still there. The problem is just that the intensity of the scattered light from the 150 and 208 nm beads obscures the much weaker scattered light from the 94 nm beads. It's a phenomenon we've called a
variable limit of detection, and it's something that all of you who measure protein aggregates or exosomes should be aware of, because it critically affects your results.
Now we're sure you're wondering what the same kind of experiment looks like when using Spectradyne's nCS1TM instrument, so here you go. First, let's look at the three monodisperse samples measured separately, and plotted on the same axes, at right. Very similar to the NTA result!
However, as you might expect, the nCS1TM measurement of the three-component mixture looks much different from the NTA one. With MRPS technology, the 94 nm beads are detected just as well as they were when measured individually. This is a key attribute of Spectradyne's MRPS-based nCS1TM instrument because the harsh reality of many biological mixtures is that they are highly polydisperse (if not quite "arbitrarily" polydisperse!).
In fact, we can almost guarantee you that your extracellular vesicle or protein aggregate samples have many more small particles than you think, if you are using only NTA or DLS to measure them. Let us repeat this another way in case we don't have your attention: If you are using only NTA or DLS, you aren't accurately measuring your biological nanoparticle sample. You may even have
false peaks that are artifacts of your measurement limitations.
All metrologies have their limitations, and we in no way mean to imply that our MRPS technology doesn't also. But we hope that as you read these blog entries, you understand that Spectradyne tries very hard to be honest and open about our limitations. At the same time, we are scientists just like you, and it's our responsibility to expose false claims from other vendors, who perhaps don't share our commitment to such disclosure.
Good luck with your nanoparticle measurements, and please contact us if you have any questions!
Please continue to follow our blog as we share insights, technical details, and generally geek-out with you about nanoparticle science!
Email us for more information, or to discuss your particular application directly.
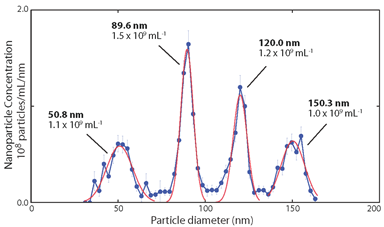
A four-component mixture of beads measured with Spectradyne's nCS1TM.
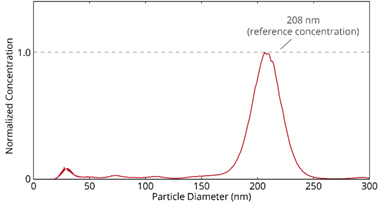
An NTA measurement of 208 nm diameter beads.
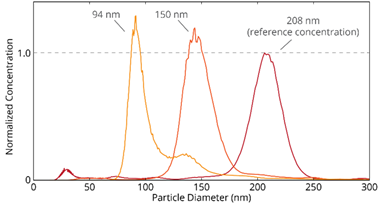
Separate, superposed NTA measurement of 94 nm, 150 nm, and 208 nm diameter beads.
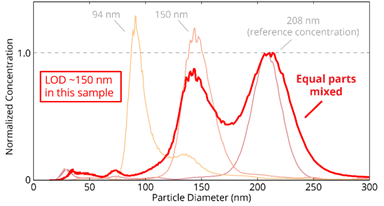
Mixture of three bead diameters measured with NTA (94 nm, 150 nm, and 208 nm diameter beads).
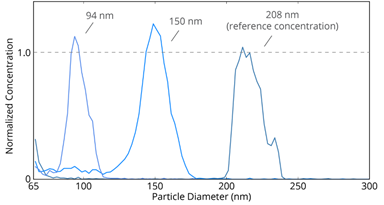
Three bead diameters measured separately with Spectradyne's nCS1TM (94 nm, 150 nm, and 208 nm diameter beads).
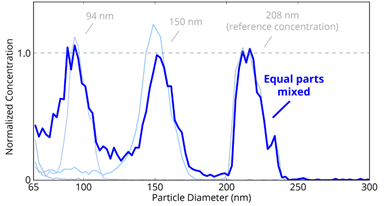
Mixture of three bead diameters measured simultaneously with Spectradyne's nCS1TM.