
Everyone working with nanoparticle formulations is used to using statistical measures to describe their mixtures. Readers of this blog will be familiar with the Concentration Spectral Density (CSD) that Spectradyne uses to convey the high resolution information on size and concentration captured by the nCS1, such as the plot to the right, showing a mixture of 3 calibration bead sizes (505 nm, 990 nm and 1760 nm diameter beads). Data from just a single 10 second acquisition is shown, hence the slightly noisy statistics.
Back to table of contents
Followers of this blog will also be used to seeing the time domain plots as well, since of course the nCS1TM counts every particle: The second plot to the right shows the time trace of the data used to make the CSD plot above it.
Expanding the vertical axis, we can see the 505 nm particle transits above the noise floor in the third plot to the right.
This is all very interesting and extremely useful for characterizing all sorts of particle mixtures: extracellular vesicles, virus particles, aggregated proteins...
But, at Spectradyne, we love data and we're always looking for more ways to dig into what they can tell us: Have you ever heard your formulation? We turned the time-domain data above into an audio file, take a listen, crank it up: Can you hear all three bead populations?
We also slowed it down five times, and then 50 times, for a different and richer listening experience. We feel we get an even better appreciation of the particles this way. Take a listen to the two versions.
First, slowed down five times.
Next, slowed down 50 times.
Of course, these are artificial bead mixes. What does a real customer sample sound like in the raw?
First, real time:
Then, slowed down 50 times:
Why do we do these things with particle sizing data? Because we can: The nCS1TM really does measure every particle that goes by. Does your current particle sizer do that? Are you listening to your data?
Do you want to hear what your formulations are trying to tell you? Give us a call!
Please continue to follow our blog as we share insights, technical details, and generally geek-out with you about nanoparticle science!
Email us for more information, or to discuss your particular application directly.
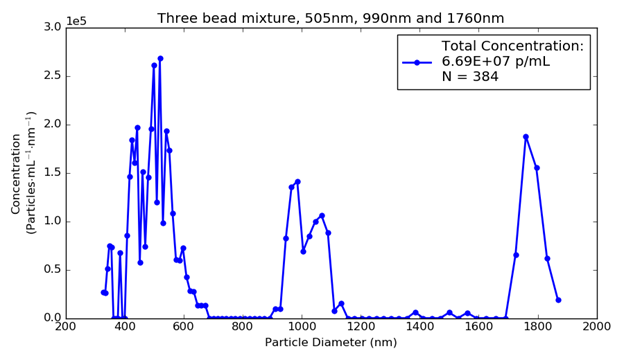
A three-component mixture of beads measured with Spectradyne's nCS1TM.
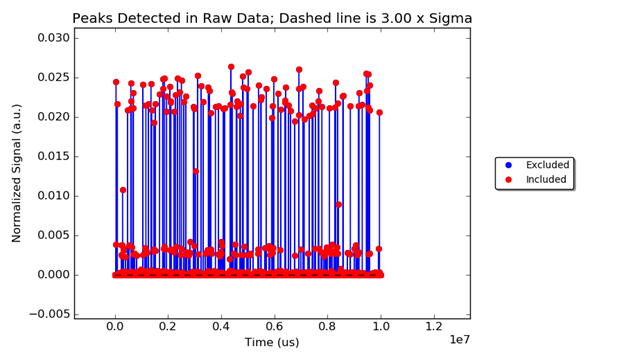
Ten seconds' worth of time domain data for the bead mixture above.
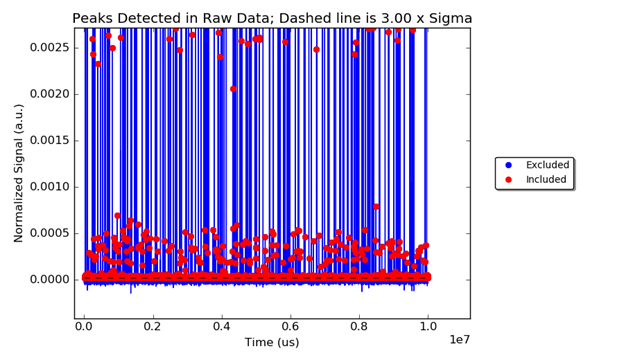
Expanding the vertical scale to show the smallest (505 nm) beads.

Spectradyne is a world leader in the microfluidic measurement of nanoparticles.
Nanoparticle analysis using resistive pulse sensing avoids many of the difficulties associated with DLS and optical tracking. Spectradyne is the only company providing microfluidic particle size analysis, now combined with single particle fluorescence.
Check us out today!