
In an earlier blog post (Peptalk blog), we talked a little bit about "limit of detection" (LOD) issues related to the intrinsic variability of instrumentation sensitivity, especially in instruments based on light scattering, especially Dynamic Light Scattering (DLS) and Nanoparticle Tracking Analysis (NTA). It's Spectradyne's experience that this is a poorly understood topic in the life sciences, yet it's critically important to extracellular vesicle researchers who are attempting to quantify the size distribution and concentration of their vesicle populations. In fact, we have seen clear examples of prominent researchers (we won't mention any names!) believing that they have successfully isolated their EVs when, in fact, Spectradyne's metrology can clearly demonstrate otherwise. With that being said, please forgive us if this post gets a little bit technical. Back to table of contents
A popular graph we like to show to motivate this discussion is shown to the right. It's a simple NTA size distribution from a measurement of urinary vesicles. The data was not taken by Spectradyne but by a third party. It appears to show a clear peak near 150 nm, and many exosome researchers would celebrate such a measurement since it appears to indicate a successful exosome isolation.
Alas, this would be a mistaken conclusion because the peak shown in the data is a phantom or, as we have taken to calling it, a false peak. How do we know? Well, fortunately this sample was measured by three orthogonal methods. We plot the NTA data along with a cryo-TEM measurement of the same sample (second plot to right).
Now, cryo-TEM is not a great method for measuring absolute concentration - so let's not worry about the absolute scale - but it is a highly accurate (and expensive) method for making relative assessments of particle counts, if one is patient about counting. It's also a non-optical method, so it's not sensitive to the optical transparency of a particle. This important orthogonal method delivers a very different conclusion from the NTA measurement. Is there a peak near 150 nm, or does the concentration of particles increase dramatically as their size decreases? What we need is a third method to break the tie. In fact, we have such a method (otherwise this would be a lame blog post), in the form of Spectradyne's nCS1 measurement, which we add to the third plot on the right (note it's plotted using a log scale).
Here we see excellent agreement between the nCS1 measurement and cryo-TEM, down to 50 nm! Now, it's important to remember that Spectradyne's nCS1 relies on an electrical method of detection called Microfluidic Resistive Pulse Sensing (MRPSTM), so it is intrinsically orthogonal both to TEM and NTA. Therefore, we have three measurement methods that rely on completely different principles of operation, and two of the three agree.
How does one explain the dramatically lower concentrations measured by NTA, especially below 130 nm, but starting as high as 250 nm? The core issue is that light-scattering intensity varies as the sixth power of particle diameter, so small particles are much harder to detect than large particles (see our
tech brief for more information). The "peak" observed in the NTA data is not a peak in particle concentration but a peak indicating the limit of detection (LOD) of the NTA method. Coincidentally (and confusingly), this LOD often occurs near where researchers expect to see a purified exosome peak. The subtle nature of the phenomenon coupled with unwitting confirmation bias (present in even the best-trained scientists) leads to erroneous conclusions.
Perhaps the reader of this blog is still skeptical. After all, it would seem that Spectradyne benefits from pointing out limitations in the technology of competing methods. While this may be true, let us emphasize that ALL metrologies have detection limits. Spectradyne's nCS1 is no different: if we try to measure exosomes below 50 nm, we will fail to detect them. If we tried, anyway, to plot the measurement below 50 nm, we would show a declining population. That wouldn't mean that there are no particles with 40 nm diameters, it would just mean that we can't detect them! Our MRPS method has its limitation like any other, but Spectradyne's data presentations and interpretations are more scientifically honest.
One final note: The false peak phenomenon is exacerbated in NTA measurements, or any optical measurements, of exosomes by the low index contrast (high transparency) of the exosomes. But in fact the phenomenon can be easily demonstrated even in mixtures of high contrast particles like polystyrene beads. For a straightforward demonstration of this, check out this poster.
That's probably enough for now. We'll conclude with the simple observation that if size distribution measurements can be misleading when dealing with particles as different as exosomes and polystyrene beads, they are in fact a challenge when dealing with any type of polydisperse mixture. Our next post will illustrate this point further with a protein aggregation measurement.
Please continue to follow our blog as we share insights, technical details, and generally geek-out with you about nanoparticle science!
Email us for more information, or to discuss your particular application directly.
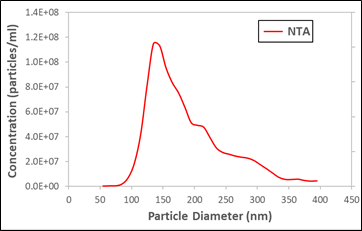
Urinary vesicle exosomes measured by NTA
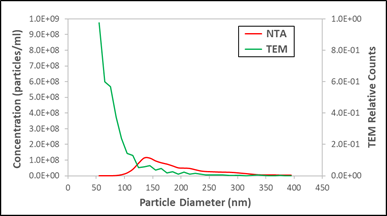
The same urinary vesicle exosome sample, comparing NTA to TEM results
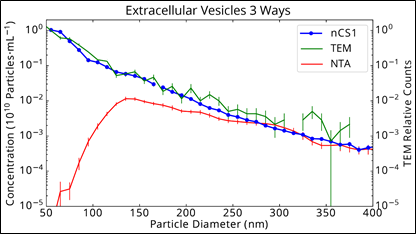
The same urinary vesicle exosome sample, comparing Spectradyne's nCS1 to NTA and TEM (note this is plotted on a log scale)

Spectradyne is a world leader in the microfluidic measurement of nanoparticles.
Nanoparticle analysis using resistive pulse sensing avoids many of the difficulties associated with DLS and optical tracking. Spectradyne is the only company providing microfluidic particle size analysis, now combined with single particle fluorescence.
Check us out today!